
Hotel underwriting in Saudi Arabia gets distorted when it anchors to a single headline visitor total. In Q1 2026, the Ministry of Tourism headline was 37.2 million tourism trips, up 8% year on year. That combined number blended two markets moving in opposite directions: inbound international visitors fell 13% to 8.3 million, while domestic trips rose 16% to 28.9 million. The combined growth therefore concealed weakness in the internationally sourced segment that lenders and investors often rely on to test destination momentum, air access sensitivity, and longer-stay revenue potential.
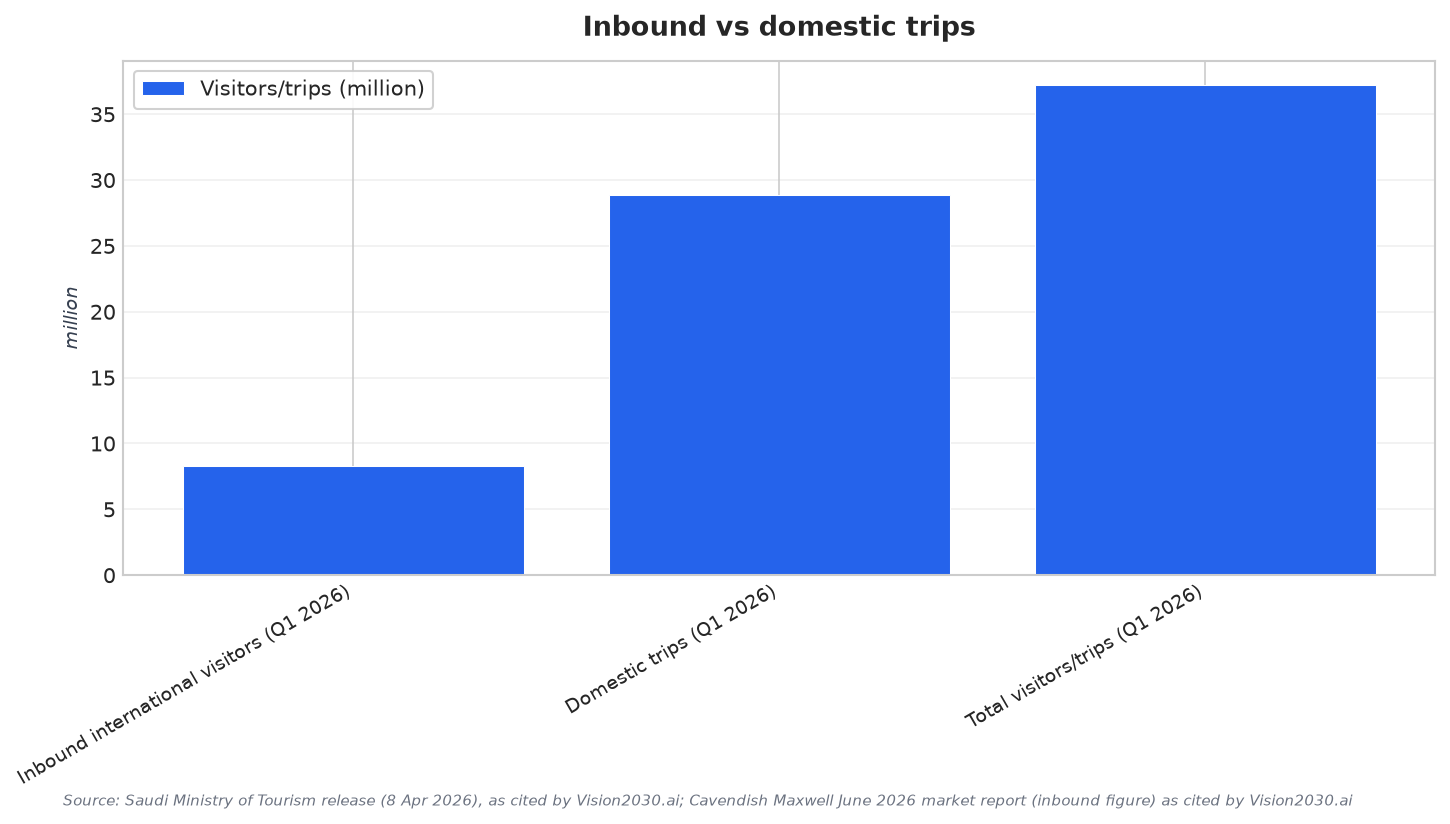
The two series are not interchangeable. Domestic trips are counted without an international standard and cannot be set against other countries’ arrivals data, while inbound arrivals can be compared and are used in global rankings. The reporting gap matters because the inbound decline in Q1 2026 was not disclosed in the April release as reported by Arab News, and only reached the public later via a Cavendish Maxwell market report that separated the series. If underwriting models ingest only the combined number, they can overestimate resilient, tradable demand and underestimate how quickly international volumes can soften.
Why Inbound Mix and Spend Matter More Than a Big Total
Inbound volume is not just a count. It changes the spending mix and the hotel-facing yield profile. In Q1 2026, international visitors were 22% of the total trip count but generated 58% of spending, alongside SAR 82.7bn in total tourism spending for the quarter. Even with arrivals down 13%, spend per inbound visitor rose roughly 6% year on year, meaning fewer visitors came but those who came spent more. That combination does not read like a collapsing destination, but it does signal that underwriting should stress-test occupancy and rate on the internationally sourced segment rather than assuming domestic growth can substitute for it.
Recent years show why the split should sit at the center of risk discussions. In 2024, Saudi Arabia recorded roughly 29.7 million international arrivals versus 86.2 million domestic visitors, within a total of 116 million. Another framing used for 2025 is “around 30 million international visitors a year” within a broader “roughly 122 million” total. Yet Seera Group stated that only about 2% of inbound trips are for leisure, implying much of inbound volume is driven by pilgrimage and visiting friends and relatives. Different segments book different products, price points, and seasons, so underwriting should separate demand by source and purpose, not just aggregate it.
Operational data reinforce why underwriting must be specific. Knight Frank reported 63.4% occupancy across Saudi hotels from January through April 2026, with an average daily rate of SAR 754 and RevPAR of SAR 478. At the same time, the market is scaling quickly: Mordor Intelligence estimates the Saudi hospitality market at USD 29.02 billion in 2026, up from USD 27.14 billion in 2025, with projections of USD 40.58 billion by 2031 at a 6.93% CAGR. With pipelines and new openings, the key underwriting question becomes whether internationally sourced nights expand in the right cities and segments, not whether a national combined visitor count prints another headline gain.
Why should hotel underwriting focus on inbound arrivals instead of total visitor headlines?
What did Q1 2026 data show about the value of international visitors?
How do hotel KPIs in early 2026 support a more detailed underwriting approach?
What do recent totals suggest about the balance between domestic and international demand?
How should investors interpret Saudi international tourist arrivals in underwriting discussions?
Talk to us for your needs in:
-
Tourism Infrastructure Planning and Optimization
-
Destination Marketing and Brand Strategy
-
Tourism Workforce Development and Training
-
Sustainable Tourism Solutions
-
Visitor Experience Enhancement and Engagement
-
Tourism Project Feasibility and Strategic Planning
-
Saudi Tourism Benchmarking