
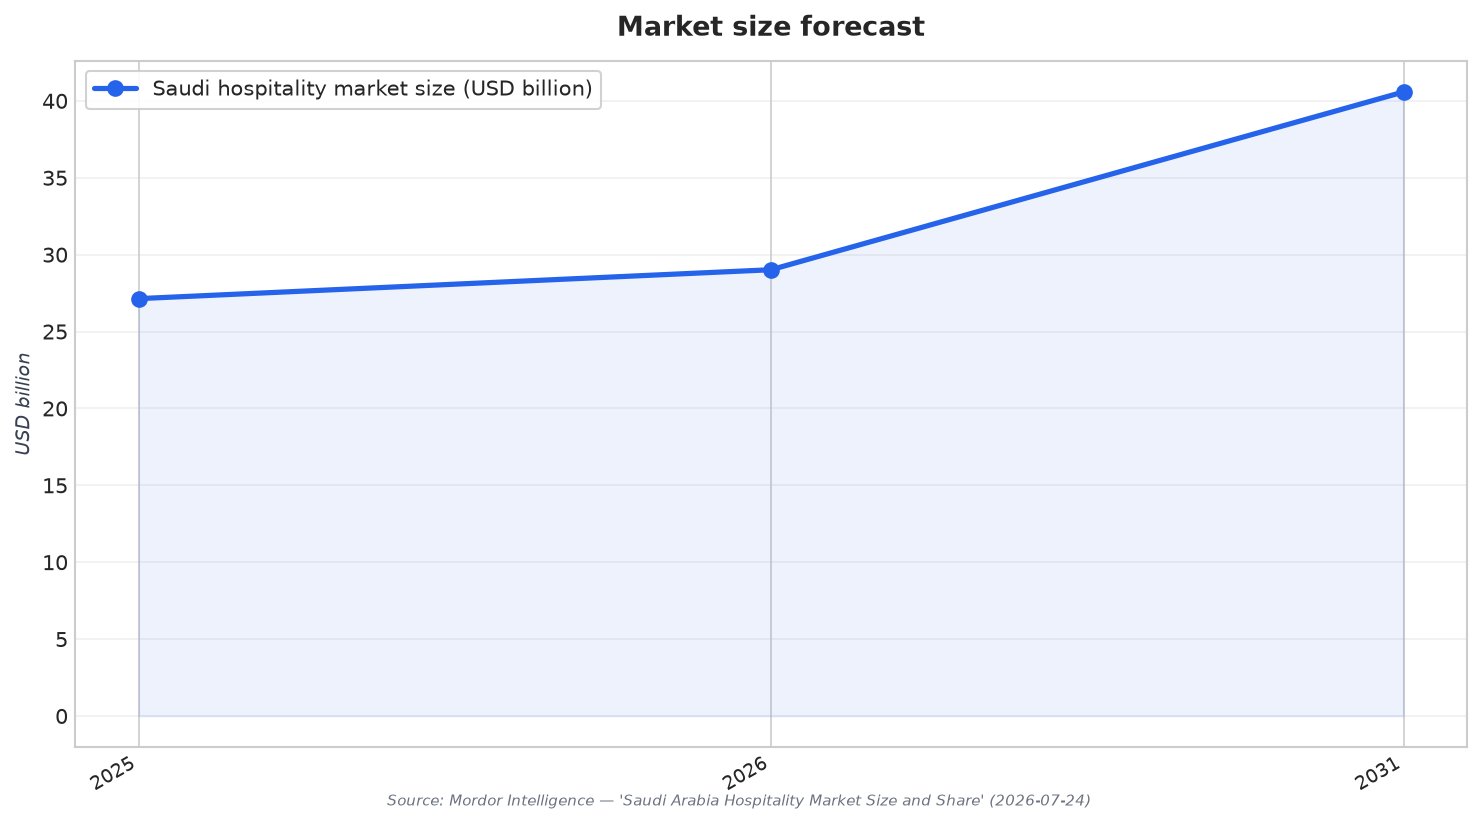
Hotel valuation in Saudi Arabia sits at the intersection of operating cash flow and fast-moving market structure. Mordor Intelligence estimates the Saudi Arabia hospitality market at USD 27.14 billion in 2025 and USD 29.02 billion in 2026, with a projection of USD 40.58 billion by 2031 (6.93% CAGR over 2026–2031). That growth story is paired with real operating momentum. A 2025 market analysis reports nationwide occupancy hovering around 60–62%, with ADR about USD 185–190 (approximately SAR 700). It also notes that in the first half of 2025, nationwide ADR reached SAR 822 (about USD 219), up 1.9% year-on-year, while occupancy averaged 62.3%. For investors, these inputs are not value by themselves, but they are the building blocks for underwriting revenue, costs, and risk in any pricing exercise.
On method, investors typically triangulate among income, market, and asset-based approaches. Hospitality Insights highlights common hotel valuation tools such as DCF, cap rate, and sales comparison. For business valuation work in Saudi Arabia, Corvian Advisory describes internationally recognised approaches including DCF, EV/EBITDA market multiples, and Net Asset Value, adjusted for Saudi-specific factors such as Zakat (ZATCA), GOSI contributions, and Saudisation (Nitaqat) compliance costs. In practice, DCF is where the operating story becomes a set of explicit assumptions, while multiples and comparable sales are faster “reasonableness checks” when reliable market evidence exists. Your result should reflect capital market conditions too, because borrowing costs and lender risk appetite can compress what buyers can pay.
Methods and Multiples That Investors Actually Use
Cap rates are one of the fastest ways to translate a stabilised income view into value, but they also embed sentiment and perceived risk. Hospitality Insights notes that value-add opportunities requiring repositioning can trade at cap rates above 10%, while prime assets in stabilised markets, like urban luxury hotels, can sit in a 6–7% cap rate range (MMCG). Multiples can also be useful when you are valuing a platform or operating company rather than only the bricks-and-mortar. Corvian points to EV/EBITDA market multiples as a standard valuation tool in Saudi Arabia, while also emphasising normalisation for local factors such as Zakat, GOSI, and Saudisation-related costs. For investors building models, that means the “E” in EBITDA must be cleaned up before applying any multiple logic.
Deal context matters because portfolio logic is increasingly part of hotel pricing, not just single-asset comparables. A Saudi tourism consulting report states that Saudi Arabia recorded 24 M&A deals worth USD 689 million in Q1 2026, a 4% annual increase in deal volume (Ansarada figures reported by Arab News). The same source frames hotel M&A as a route to speed and scale, with a focus on conversions and repositioning. It also reports that Hilton surpassed 100 hotels trading and in the pipeline in Saudi Arabia, with 21 operating and 83 in the pipeline, representing USD 8 billion of combined investment from owners and investors. These signals help investors think about platform premiums, brand-enabled cash flow stability, and the time-to-market advantage of acquisitions over new development.
Benchmarks should also reflect where demand is coming from and how supply is segmented. Mordor reports chain hotels held 57.74% of Saudi Arabia’s hospitality market share in 2025, while the luxury segment led with 36.92% of market size in 2025. It also notes OTAs captured 41.65% of transactions in 2025, with direct digital channels growing at a 14.78% CAGR, which can influence distribution costs and margin assumptions in your cash flow. On geography, Mordor says the Makkah–Jeddah corridor held 26.62% of market size in 2025, and the Red Sea and wider western coast are set to expand at an 18.20% CAGR to 2031. On demand, Mordor cites Hajj attendance at approximately 2.1 million in 2025 and 1.71 million in 2026, with Umrah pilgrims at 18 million in 2025 and expected to exceed 20 million in 2026, and average spending of USD 5,400 per pilgrim. These figures are not “valuation multiples,” but they are deal-critical drivers of seasonality, base demand, and underwriting confidence in specific corridors.
What are the core methods used for hotel valuation in Saudi Arabia?
What cap rate ranges are cited as benchmarks for hotel assets?
Which Saudi market indicators can help anchor underwriting assumptions?
How do deal conditions and M&A activity inform valuation benchmarks?
Which submarkets and demand segments are highlighted as important for pricing risk?
Talk to us for your needs in:
-
Tourism Infrastructure Planning and Optimization
-
Destination Marketing and Brand Strategy
-
Tourism Workforce Development and Training
-
Sustainable Tourism Solutions
-
Visitor Experience Enhancement and Engagement
-
Tourism Project Feasibility and Strategic Planning
-
Saudi Tourism Benchmarking